Plotly Python Open Source Graphing Library
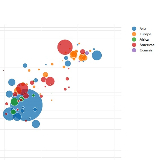
Plotly's Python graphing library makes interactive, publication-quality graphs. Examples of how to make line plots, scatter plots, area charts, bar charts, error bars, box plots, histograms, heatmaps, subplots, multiple-axes, polar charts, and bubble charts.
Plotly.py is free and open source
and you can view the source, report issues or contribute on GitHub.
Write, deploy, & scale Dash apps and Python data visualization on a Kubernetes Dash Enterprise cluster.
Get Pricing
|
Demo Dash Enterprise
|
Dash Enterprise Overview